The GHCN is the benchmark database which NOAA’s NCEI uses to make statements such as:
The combined average temperature over global land and ocean surfaces for October 2015 was the highest for October in the 136-year period of record, at 0.98°C (1.76°F) above the 20th century average of 14.0°C (57.1°F).
These kinds of statements have always intrigued me. As an economist, I am acutely aware of the problems involved in data panels which enable legitimate comparisons between points in time to be made. Given that humans did not use stratified sampling methods to measure temperatures consistently at well defined locations, I am not convinced how much one can rely on these proclamations of “highest temperatures” in recorded history.
The data set itself is available on NOAA’s web site, and is updated regularly. In the past, I have tried to visualize average temperatures:
and where on earth those temperature measurements come from:
Today, I am going illustrate how you can explore this data set using Perl, SQLite, and SQL.
The current snapshot of the QCA data set I downloaded stands at 462,967 lines where each line contains a year’s worth of temperature measurements from a given temperature station. Temperature values are encoded as integers representing the monthly average temperature in hundreths of a degree Celsius. For example, a value of 1234 stands for 12.34°C. Missing values are represented as -9999.
One cannot be blamed for wondering whether a monthly average temperature of 12.34°C in 1915 in Göztepe, İstanbul is the same as a monthly average temperature of 12.34° in 2015 at the same location: Neither the location nor the thermometers are the same.
I am kidding, of course: There are no observations in the GHCN from Göztepe in the year 2015. For some reason, the most recent observation from this location is December 2013. It is not like the State Directorate of Meteorology stopped measuring in Göztepe. There is a new automatic station there that does not appear in the GHCN. And, just like that, İstanbul no longer enters the GHCN.
So, how can you get started finding out whether your country, city, or airport is included in the GHCN?
First, download the most recent QCA data set:
curl -O ftp://ftp.ncdc.noaa.gov/pub/data/ghcn/v3/ghcnm.tavg.latest.qca.tar.gzThat’s about 12 MB. While you are at it, also fetch the README and the country codes.
The downloaded archive will include two text files. The .dat file contains the data, and the .inv contains meta information about the temperature stations that appear in the data set. A long time ago, I combined this information to put together temperature graphs for each location in version 2 of the GHCN—Maybe it’s time to update that ;-)
The following short Perl script will reshape the data set so that each row is a single temperature observation:
#!/usr/bin/env perl

use 5.020;
use warnings;

use Const::Fast;
use Path::Tiny;

run( @ARGV );

sub run {
    my $ghcn = shift;

    const my @INPUT_FIELDS => (
        [ COUNTRY => 'A3' ],
        [ STATION => 'A5' ],
        [ STAIDX  => 'A3' ],
        [ YEAR    => 'A4' ],
        [ VAR     => 'A4' ],
        (
            [ VALUE  => 'A5' ],
            [ DMFLAG => 'A1' ],
            [ QCFLAG => 'A1' ],
            [ DSFLAG => 'A1' ],
        ) x 12,
    );

    const my %KEY_FIELDS => (
        COUNTRY => 0,
        STATION => 1,
        STAIDX => 2,
        YEAR => 3,
    );

    const my $T_JAN_IDX => 5;
    const my $T_MONTH_SKIP => 4;

    const my $UNPACK_FMT => join ' ', map $_->[1], @INPUT_FIELDS;

    my $fh = path( $ghcn )->openr;

    while (my $obs = <$fh>) {
        my @obs = unpack $UNPACK_FMT, $obs;
        my @key = @obs[ @KEY_FIELDS{ qw( COUNTRY STATION STAIDX YEAR ) }];

        for my $month (0 .. 11) {
            say join("\t",
                @key,
                $month + 1,
                $obs[ $T_JAN_IDX + $T_MONTH_SKIP * $month ],
            );
        }
    }
    close $fh
        or die "Cannot close '$ghcn': $!";

    return;
}
which you can run using the command line:
perl import-ghcn-temp.pl ghcnm.tavg.v3.3.0.20151121.qca.dat > ghcnm.tavg.v3.3.0.20151121.qca.tsvThen, you can import these observations into an SQLite database using the following:
DROP TABLE IF EXISTS 'ghcn';

CREATE TABLE 'ghcn' (
    COUNTRY char(3),
    STATION char(5),
    STAIDX char(3),
    YEAR char(4),
    MONTH integer,
    T integer
);

.headers off

.separator "\t"

.import ghcnm.tavg.v3.3.0.20151121.qca.tsv ghcn
Then, you can run queries against it to your hearts’ content:
sqlite> select count(*) from ghcn;
5555604
sqlite> select count(*) from ghcn where T <> -9999;
4931273
If you want to calculate averages, you should make sure not to include those -9999 values:
sqlite> create view ghcn_nomiss as select * from ghcn where t <> -9999;
sqlite> select count(*) from ghcn_nomiss;
4931273
Also, as you can deduce from NOAA’s statement above, we are only interested in observations since 1880:
sqlite> create view ghcn_nomiss_post1880 as select * from ghcn where t <> -9999 and year >= 1880;
sqlite> select count(*) from ghcn_nomiss_post1880;
4782815
sqlite> select avg(t) from ghcn_nomiss_post1880;
1235.56938748415
sqlite> select avg(t) from ghcn_nomiss_post1880 where year < 1901;
1099.68878326256
sqlite> select avg(t) from ghcn_nomiss_post1880 where year > 1900 and year < 2001;
1229.67250846626
sqlite> select avg(t) from ghcn_nomiss_post1880 where year > 2000;
1360.43513443338
NOAA’s figure of an average temperature of 14.0°C for the 20th century is for the combined land and ocean average, and the GHCN only contributes to the land part of that. I am not looking at ocean temperatures here.
Keep in mind that some station ids may appear multiple times where histories are distinguished by an index. For example, Riviere Du Lo has up 10 different variations in some years:
sqlite> select * from ghcn where station='71715' and year=1966 and month=10;
403|71715|000|1966|10|590
403|71715|001|1966|10|540
403|71715|002|1966|10|720
403|71715|004|1966|10|569
403|71715|005|1966|10|600
403|71715|006|1966|10|624
403|71715|007|1966|10|640
403|71715|008|1966|10|590
403|71715|009|1966|10|520
403|71715|010|1966|10|550
That would mean this station in Canada would be given 10 times the weight of Palmyra:
sqlite> select * from ghcn where year=1966 and month=10 and station=40061;
647|40061|000|1966|10|2073
There is no way of dealing with these multiple histories that does not involve some sort of trade-off. But, averaging is a quick and easy way out, so the average of October 1996 temperatures in Syria and Canada comes out to be about 13.34°C rather than 7.29°C:
create view ghcn_nomiss_post1880_combined as
    select
        country,
        station,
        year,
        month,
        avg(t) as t,
        count(*) as n_histories
    from
        ghcn_nomiss_post1880
    group by
        country,
        station,
        year,
        month
;
GHCN monthly also includes observations from ships and Antarctica. I am not 100% certain, but I do not think those are included in the global land average. So, let’s get rid of those:
sqlite> create view ghcn_nomiss_post1880_combined_noship_noantarctica as select * from ghcn_nomiss_post1880_combined where not(country like '7%' or country like '8%');Let’s look at those global averages again:
sqlite> select avg(t) as t_october_2015 from ghcn_nomiss_post1880_combined_noship_noantarctica where year=2015 and month=10;
t_october_2015
1544.57110910187

sqlite> select avg(t) as t_global_october_20th_century from ghcn_nomiss_post1880_combined_noship_noantarctica where year > 1900 and year < 2001 and month=10;
t_global_october_20th_century
1422.33545196706
where the difference between October 2015 and the 20th century average for October temperatures ends up being about 1.22°C, a full 0.11°C lower than the figure in NOAA’s announcement.
I am not sure regarding the source of the difference, but note that the data set I am using was generated 21 days ago, so new observations may have been added in that time. I am not sure what has changed, and there really isn’t an easy way to get the exact data set on which NOAA’s “State of the Climate” reports.
I am more interested in data source heterogeneity than in average temperatures. You can see in my animation of station locations that, over time, there are more observations from some countries than from others.
While, the U.S. is just 2% of the world’s surface area, temperature stations in the U.S. are over-represented in the “Global” Historical Climatology Network:
sqlite> select count(*) from ghcn_nomiss_post1880 where country='425';
1865622
sqlite> select count(*) from ghcn_nomiss_post1880 where country<>'425';
2917193
meaning, almost 40% of all non-missing observations since 1880 are from the U.S. In the 21st century, more than 45% of all non-missing observations are from the U.S.
Canada contributes the next highest number of observations to the database. In fact, here is the top 10 by the number of observations they contribute to the GHCN:
Country                                %
-------------------------------------- -----
United States of America               39%
Canada                                  9%
Australia                               7%
China                                   5%
Japan                                   3%
Russian Federation (Asian Sector)       3%
Turkey                                  2%
India                                   1%
Argentina                               1%
Russian Federation (European Sector)    1%
The U.S. represents more of the data in the GHCN then the next nine countries put together, and these 10 countries are the source of 71% of all the data in the GHCN which, at its height included data from about 215 different countries.
If you look at data for the 21st century, the picture changes a bit:
Country %
----------------------------------- -----
United States of America 45%
Russian Federation (Asian Sector) 4%
China 3%
Australia 3%
Japan 3%
Argentina 2%
Canada 2%
Turkey 2%
Algeria 2%
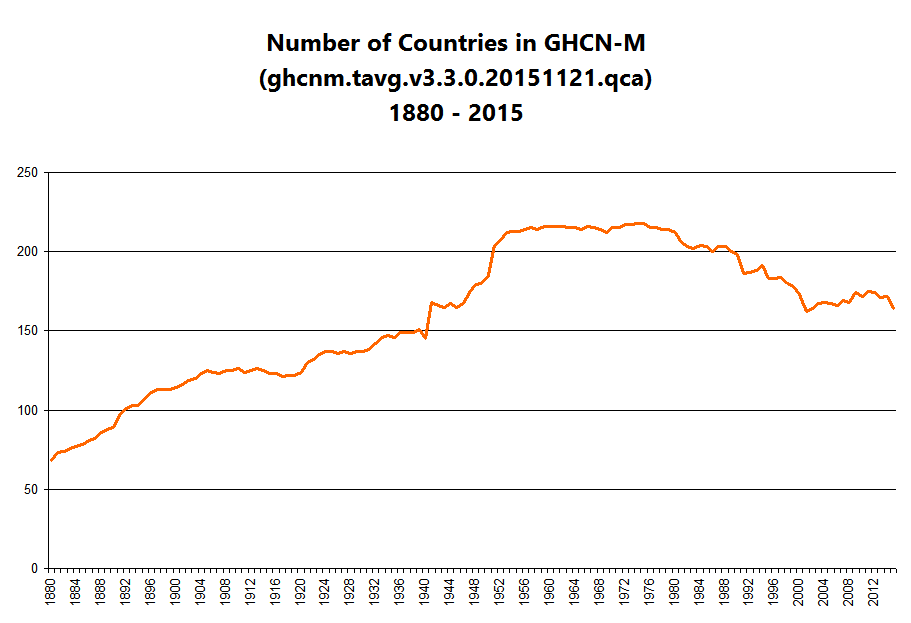
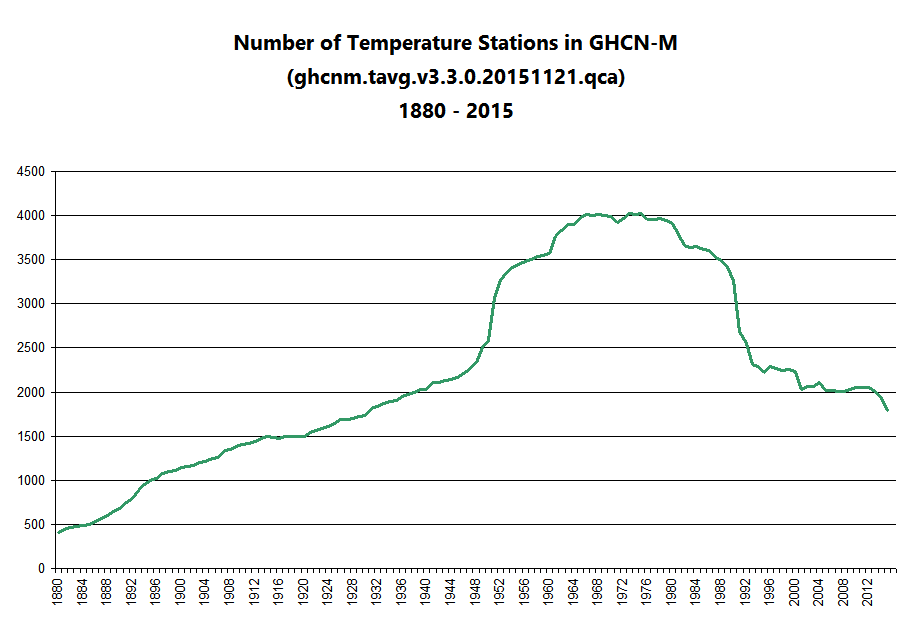
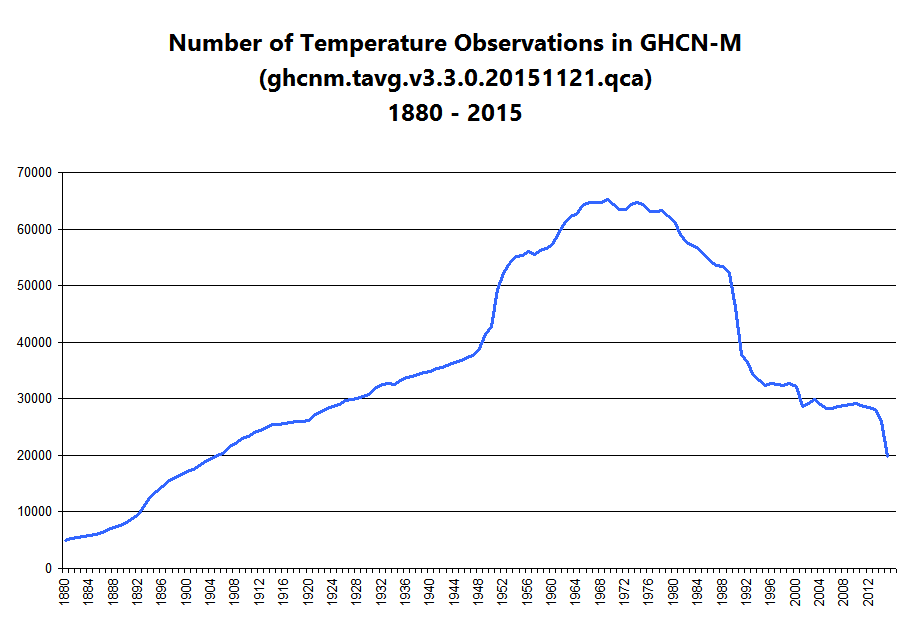
India 1%Here are some graphs which I hope demonstrate why I am concerned about uncontrolled data source heterogeneity:
Number of countries in the GHCN by year
Number of stations in the GHCN by year
Number of observations in the GHCN by year
Average annual temperature in the GHCN by year
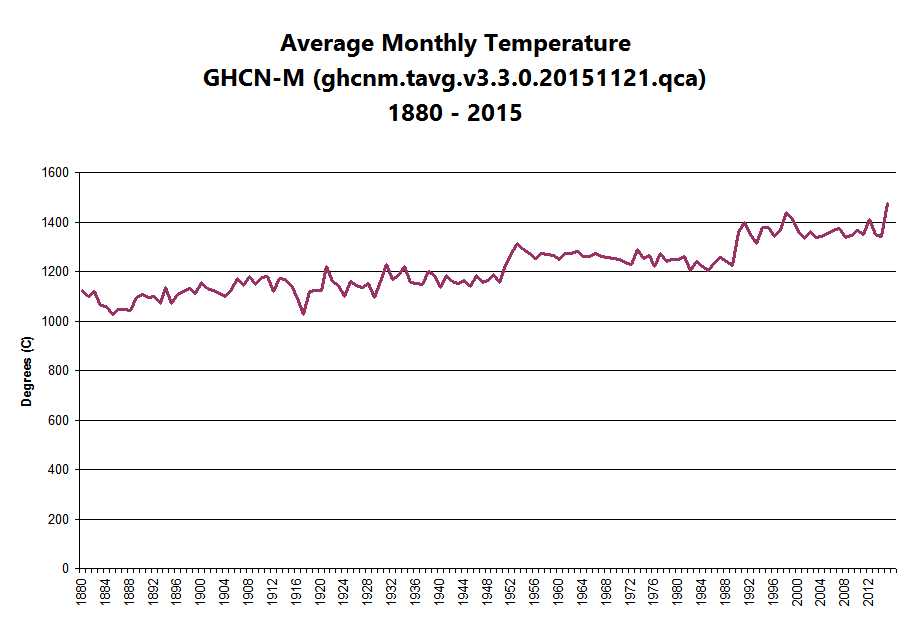
Looking at that last graph of annual average temperatures, note the obvious discrete jumps in 1950 and 1989. Then, take a look at the graph of number of observations by year, and notice that the pimple in the middle basically corresponds to that same period.
I find this interesting.
So, now you are familiar with the benchmark database of land surface temperatures which NOAA uses to make pronouncements about global warming. It might be useful to approach this set of numbers and dig around during the period leading up to the Paris climate change conference.
You can discuss this post on /r/perl.